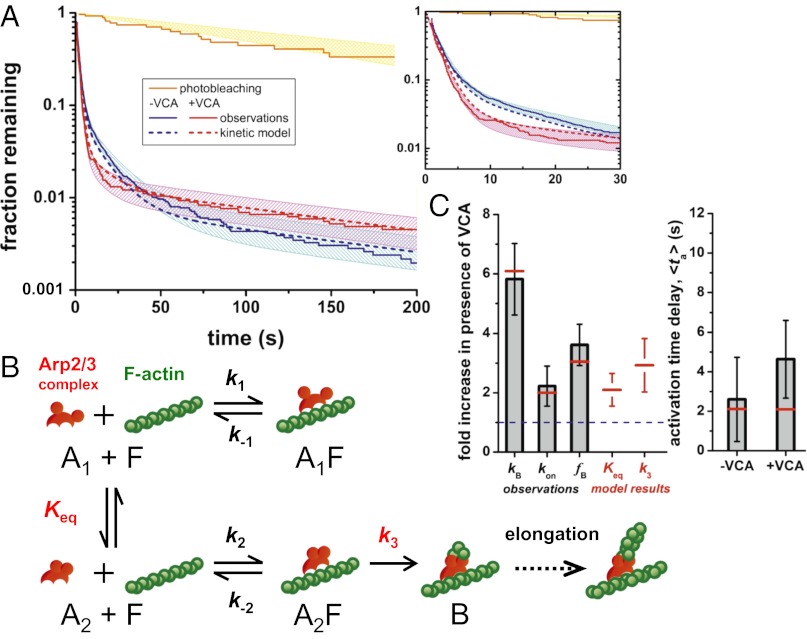
Fig. 4.
Complex lifetimes and hypothesized branch nucleation mechanism. (A) Example lifetime distributions of filament-bound Arp2/3-SNAP549 complexes (Materials and Methods; Fig. S4). Curves show lifetimes of all complexes with (red; NV = 2,151) and without (blue; n = 3,654) VCA, and the subset of complexes at branches (yellow; NB = 24). Shading: 90% confidence intervals. (Inset) Magnified view. (B) Kinetic scheme for actin nucleation by Arp2/3 complex. Red circles represent the Arp2 and Arp3 subunits. Only the off-filament conformational equilibrium constant (Keq) and the on-filament activation rate (k3) are altered by the presence of VCA. The presence of three filament-bound states (A1F, A2F, and B) produces the predicted triexponential lifetime distributions (A, dashed lines). (C) Comparison of observed quantities (gray) and predictions from the model in B (red). VCA-stimulation ratios (Left) of the rate of branch formation (kB), the rate of Arp2/3 complex binding to filaments (kon), and the fraction of filament-bound Arp2/3 complexes that nucleate daughter filaments (fB) are shown together with the values of the two model parameters, Keq and k3, that are VCA-dependent. Also shown (Right) are the observed activation times and the corresponding model predictions.

