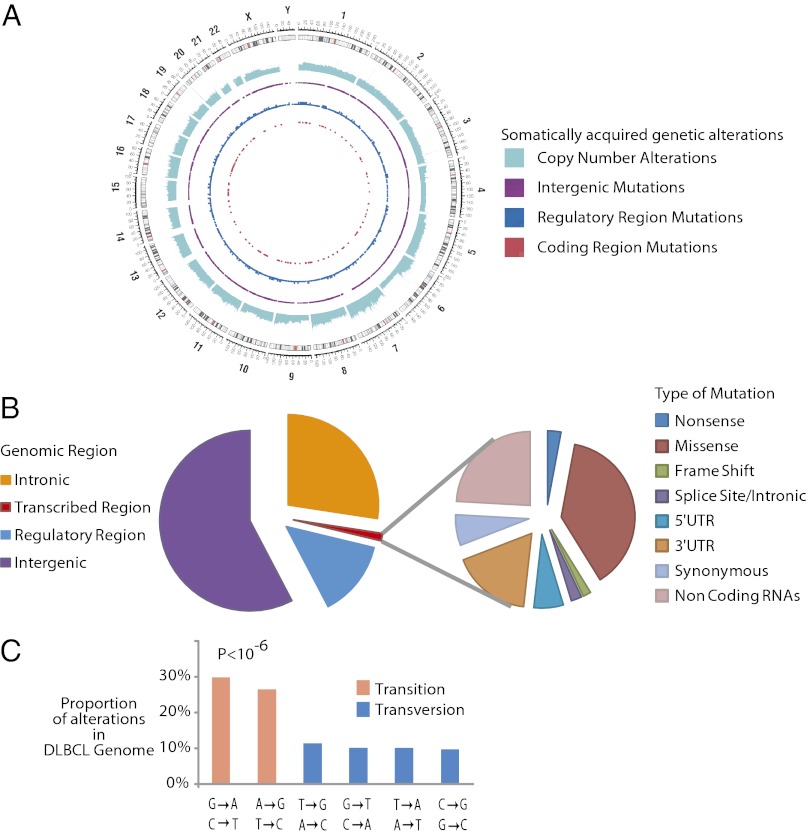
Fig. 1.
Results from sequencing a lymphoma genome. (A) Circos diagram (36) summarizing the somatically acquired genetic variants in a DLBCL genome. The outermost ring depicts the chromosome ideogram oriented clockwise, pter-qter. The next ring indicates copy number alterations in the DLCBL genome. The next three rings indicate somatically acquired mutations in intergenic regions, potential regulatory regions, and the exome respectively. (B) Pie chart depicts the relative number of somatically acquired mutations in the DLBCL genome, which can be classified by their genomic location as intergenic, intronic, potential regulatory, or transcribed regions (Left). (Right) Breakdown of different mutation types observed in the transcribed regions. (C) Histogram depicts the mutation profile of DLBCL. The proportion of mutations in each of the six mutational classes is shown. Transitions represent the majority of the somatically acquired mutations (P < 10−6).

