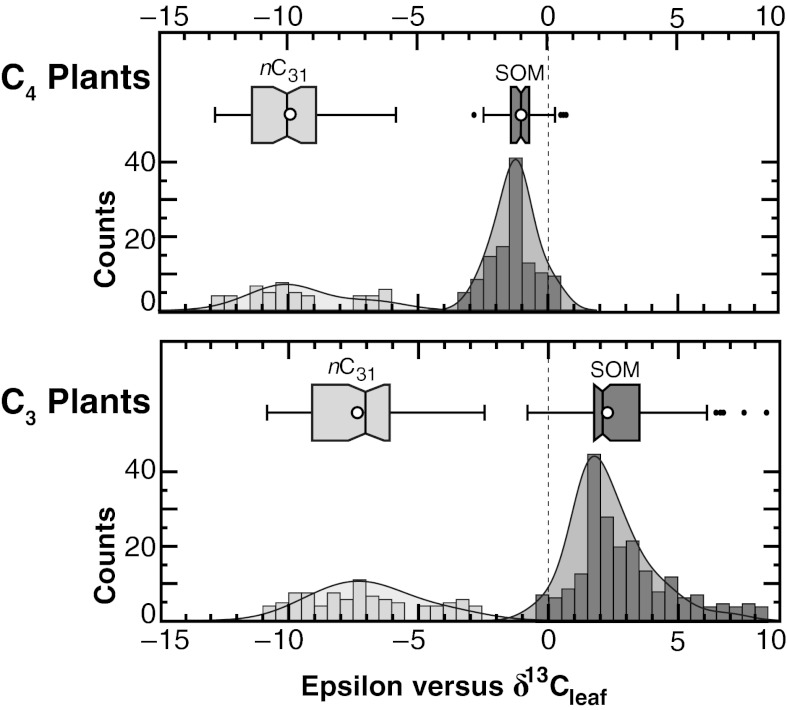
Fig. 2.
Histograms and box-and-whisker plots for ɛSOM/31 from published δ13CSOM and δ13C31 values from subtropical and tropical regions (SI Appendix). Published data are binned at 0.5‰ intervals (counts) based on site averages. Values for δ13CSOM (dark gray) and δ13C31 (light gray) are plotted relative to δ13Cleaf. Values of ɛSOM/31 equal about 9‰ in both C3 and C4 ecosystems. Individual boxes contain interquartile ranges (IQRs). Bold vertical lines within boxes mark median values. ○, mean values. Horizontal whiskers mark minimum and maximum values, except values outside of 1.5 IQR (●). Notch half-width values indicate confidence in differentiating median values.

