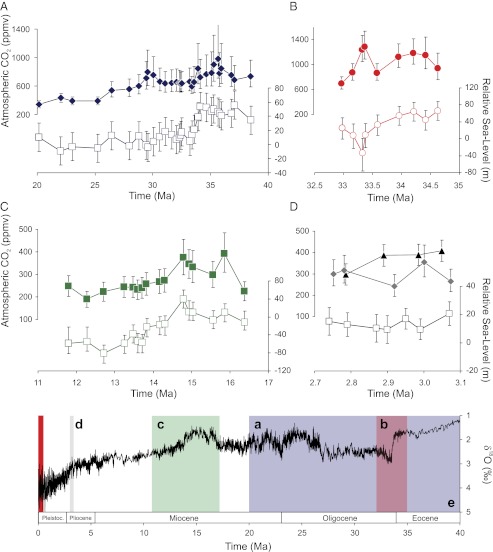
Fig. 2.
Time series of sea-level and CO2 data used to construct Fig. 3. (A) Alkenone δ13C based CO2 (13) and sea level based on sequence stratigraphy of the NJM (27). (B) Boron isotope-based CO2 record (15) with sea level based on the oxygen isotope composition of planktic foraminifera fixed at ice-free (e.g., pre-Eocene–Oligocene boundary) = + 65 m (SI CO2 and Sea-Level Estimates). (C) Boron isotope-based CO2 record (18) with sea level from the benthic foraminiferal δ18O (45) fixed to the Miocene highstand of the NJM sequence stratigraphic record (28) (SI CO2 and Sea-Level Estimates). (D) Boron isotope-based CO2 records (gray diamonds) (17) and (black triangles) (16). Sea-level record from a compilation (26) using several methodologies, including sequence stratigraphy and benthic foraminiferal δ18O corrected for temperature (see ref. 26 for details). Note CO2 and highstands do not correlate exactly in time, but in each case sea-level estimate and CO2 are within 10,000 y. (E) Benthic oxygen isotope stack (30) with the locations of the time slices shown in A–D (and Fig. 1), shown as appropriately colored and labeled band. All data displayed in (A–D) can be found in Dataset S1.

