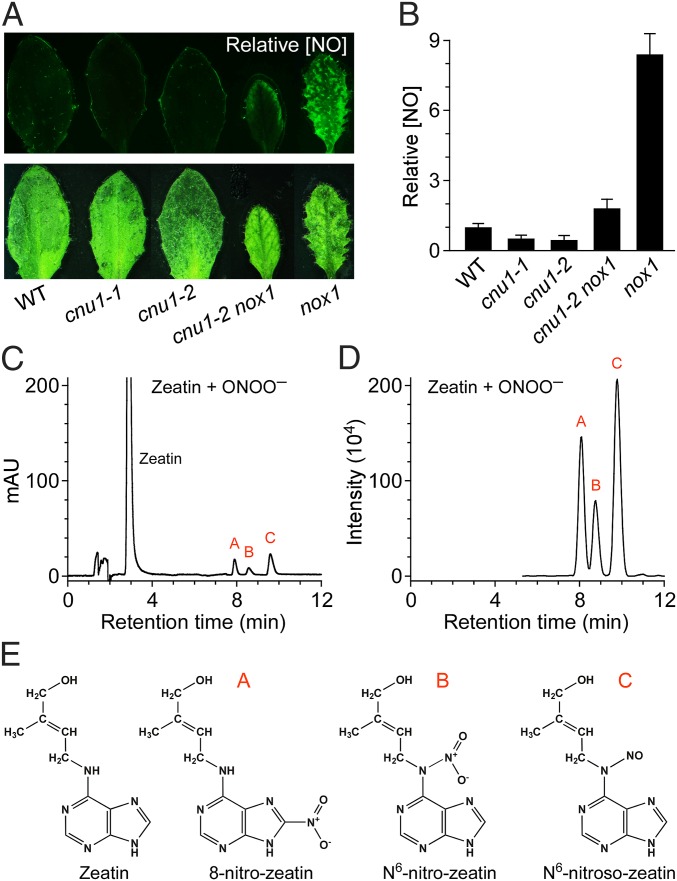
Fig. 3.
Excessive NO nitrates the adenine group of cytokinins and leads to the reduction of endogenous NO levels. (A) The endogenous NO levels in WT, cnu1-1, cnu1-2, cnu1-2 nox1, and nox1. Leaves were stained with DAF-2DA (Upper). (Lower) White-light images are shown. A total of 50 leaves were analyzed for each genotype in three independent experiments, and similar results were obtained. (B) Quantification of the relative NO levels for various genotypes grown in A. The relative NO level of WT was arbitrarily set to 1 (mean ± SD; n = 50). (C and D) HPLC-UV and HPLC-MS/MS profile of the reaction products of peroxynitrite with trans-zeatin in test tube at pH 9.5. The reaction solution of trans-zeatin and peroxynitrite (Zeatin + ONOO–) was run through HPLC and monitored by UV absorption (C) or MS/MS detection (D). Similar results were seen from more than 10 independent experiments. (E) The chemical structures of zeatin and the identified reaction products. Peaks A, B, and C in HPLC-UV (C) and HPLC-MS/MS (D) profile correspond to 8-nitro-trans-zeatin, N6-nitro-trans-zeatin, and N6-nitroso-trans-zeatin, respectively.

