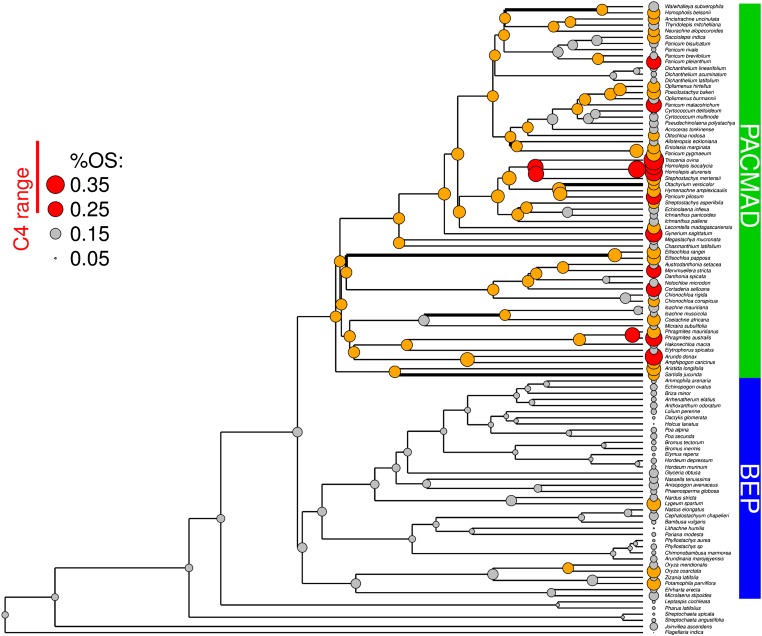
Fig. 3.
Evolution of %OS in grasses. The measured and inferred values of %OS are mapped on a calibrated phylogeny of the C3 grasses included in this study. The diameter of the dots is proportional to %OS values. The values in the C4 range are indicated in red and those outside the C4 range but above the threshold that promotes C4-OS evolution are in orange. Branches where the C3 to C4-OS transitions occurred are thicker.

