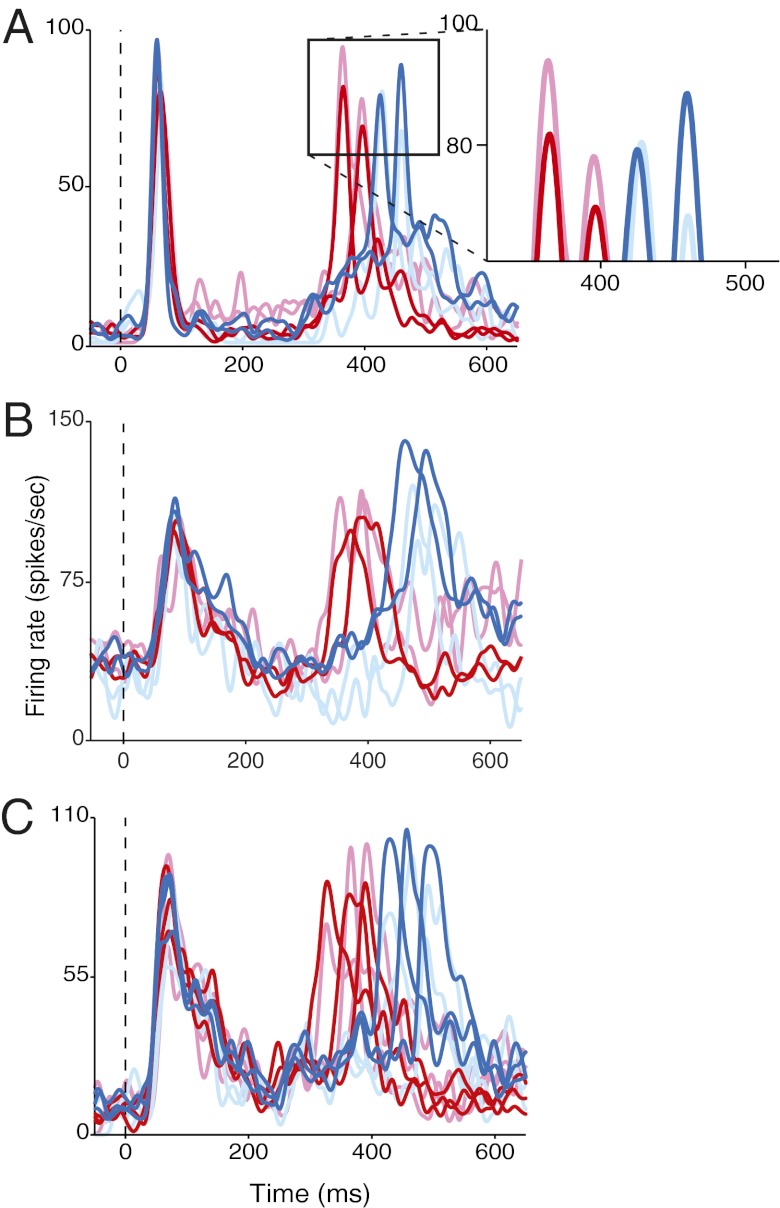
Fig. 2.
Responses of three single FEF neurons to short (red) and long (blue) intervals during temporal-discrimination task. (A) SOAs: 300, 333, 367, 400 ms. Lighter colors indicate activity during incorrect trials. Activity traces are aligned to first stimulus onset (dashed vertical line). (Inset) Close-up of the second visual responses. (B) SOAs: 283, 317, 383, 417 ms. (C) SOAs: 267, 300, 333, 367, 400, 433 ms.

