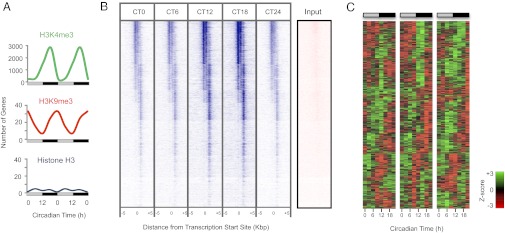
Fig. 1.

Circadian cycling of chromatin marks at promoter regions in mouse liver. (A) Whole-genome cycling of activating (H3K4me3) and inhibitory (H3K9me3) chromatin marks but not unmodified histone H3, over the circadian day and night. Data are double-plotted for clarity. Light gray bars indicate circadian daytime; black bars signify circadian night. (B) Heat map of H3K4me3 binding signal at CT0 to CT18 (with CT0 replotted), from –5 kb to +5 kb surrounding the center of all coding gene loci. ChIP-seq with anti-H3K4me3 antiserum was performed, and data were analyzed as described in SI Appendix. Each line represents a single H3K4me3-binding region. CT, circadian time (animals maintained in constant darkness, with subjective dawn represented by CT0, and dusk represented by CT12). The input (nonenriched) DNA signal at the same locus is shown for comparison. (C) Heat map of genes exhibiting circadian expression that also undergo rhythmic change in H3K4me3 binding at their promoter regions. Normalized expression is shown for three independent biological replicate sets of liver, sampled every 3 h in constant conditions.
