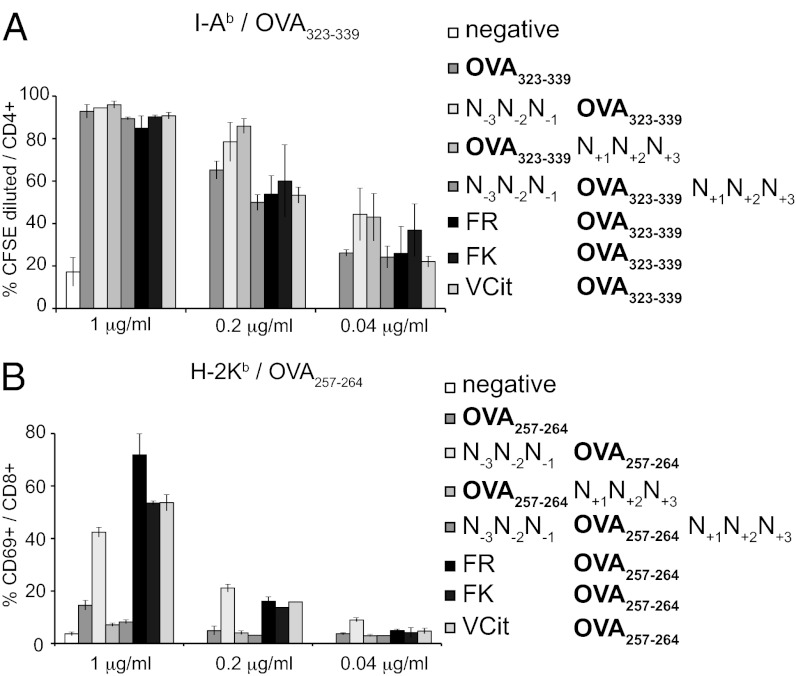
Fig. 3.
In vitro stimulation of antigen-specific CD4 and CD8 T cells by DCs incubated with sortagged αDEC205. (A) DCs were incubated in vitro with αDEC205 sortagged with HA tag (negative) or OVA323-339–containing probes (Table S1) at various concentrations, washed, and incubated together with CFSE-labeled splenocytes from OTII transgenic mice at day 0. The histogram shows the percentage of CFSE-diluted OTII CD4 T cells at day 4 for each concentration of αDEC205 adduct used. (B) BMDCs were incubated in vitro with medium alone (negative) or αDEC205 sortagged with OVA257-264–containing probes (Table S1) at various concentrations, washed, and incubated together with splenocytes from OTI transgenic mice. The histogram shows the percentage of CD69-positive CD8 OTI T cells for each concentration of αDEC205 adduct used after 16 h. Errors bars show SDs of three independent measurements; representative of three independent experiments.

