Fig. 5.
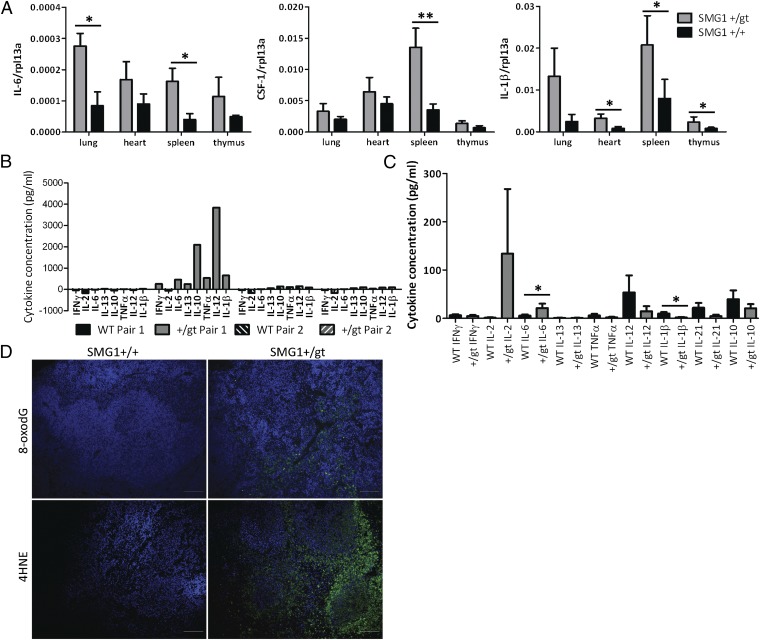
Smg1+/gt mice have elevated basal levels of cancer-related cytokines. (A) RNA was isolated from the indicated tissues, cDNA synthesis was performed, and cytokine mRNA levels were measured by real-time PCR. Expression levels are expressed relative to the control gene rpl13a. Data presented are pooled from a minimum of five pairs of Smg1+/gt and Smg1+/+ littermates analyzed in independent experiments. Data are expressed as mean ± SEM. A Student t test was performed to determine statistical significance: *P < 0.05; **P < 0.01. (B) Serum cytokine levels were measured by cytokine bead array in Smg1+/gt and Smg1+/+ mice. (C) Serum cytokine levels for mice not showing extreme cytokine production (as in B) were pooled and analyzed. Data shown are from a minimum of seven Smg1+/gt or Smg1+/+ mice. Data are expressed as mean ± SEM. A Student t test was performed to determine statistical significance: *P < 0.05. (D) Oxidative damage to tissues was measured by immunofluorescent staining for 8oxodG or 4-hydroxynonenal (4HNE; green), and tissues were counterstained with DAPI (blue) to show nuclei. Tissues from Smg1+/gt spleens of mice with hyperplasia were compared with those of Smg1+/+ mice of a similar age. (Scale bar = 100 μM.)

