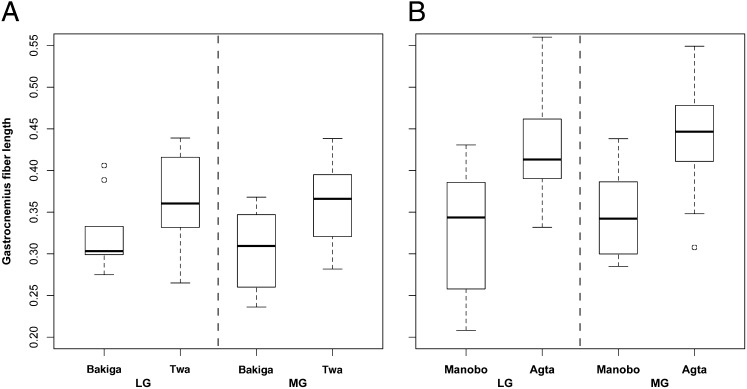
Fig. 4.
Muscle architecture measurements in African (Twa and Bakiga) and Philippine populations (Agta and Manobo). (A) Boxplot of fiber length, normalized for muscle length, of the lateral (LG) and medial (MG) gastrocnemius muscles of Bakiga men (n = 9) and Twa men (n = 29), shown on left. (B) Boxplot of fiber length comparing Manobo men (nManobo-LG = 18, nManobo-MG = 16) and Agta (nAgta-LG = 23, nAgta-MG = 24) men.

