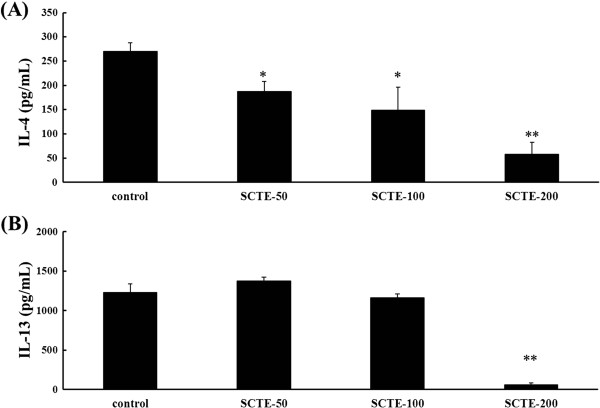
Figure 9.
Effects of SCTE on IL-4 and IL-5 levels in splenocytes. (A) IL-4 level; (B) IL-5 level. Control, Con-A-stimulated cells, negative control (PBS only); SCTE-50, Con-A stimulated + SCTE 50 μg/mL; SCTE-100, Con-A stimulated + SCTE 100 μg/mL; SCTE-200, Con-A stimulated + SCTE 200 μg/mL. Significantly different from control, *P < 0.05, **P < 0.01.

