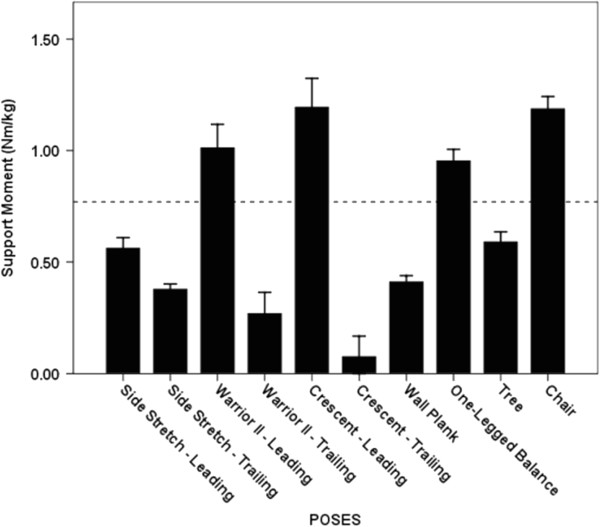
Figure 3.
Average Support moments. The dashed line indicates the average peak support moment generated during walking at a self-selected speed. The whiskers represent standard errors. There was no statistically significant difference among the 4 poses generating the greatest average support moments (p = 0.07 – 1.00).

