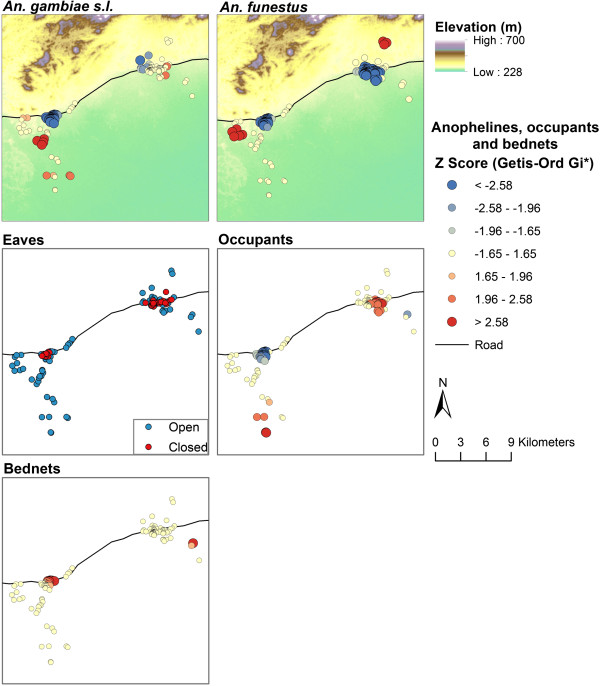
Figure 5.
The spatial clustering of Anopheles gambiae s.l. and Anopheles funestus densities computed over each month in 2008. As well as the elevation profile, distribution of houses with closed/open eaves, and the spatial clustering of the number of household occupants and the number of LLINs per person. Note: The blue end of the scale represents clustering of households with low mosquito densities, where the red end of the scale represents high mosquito densities.

