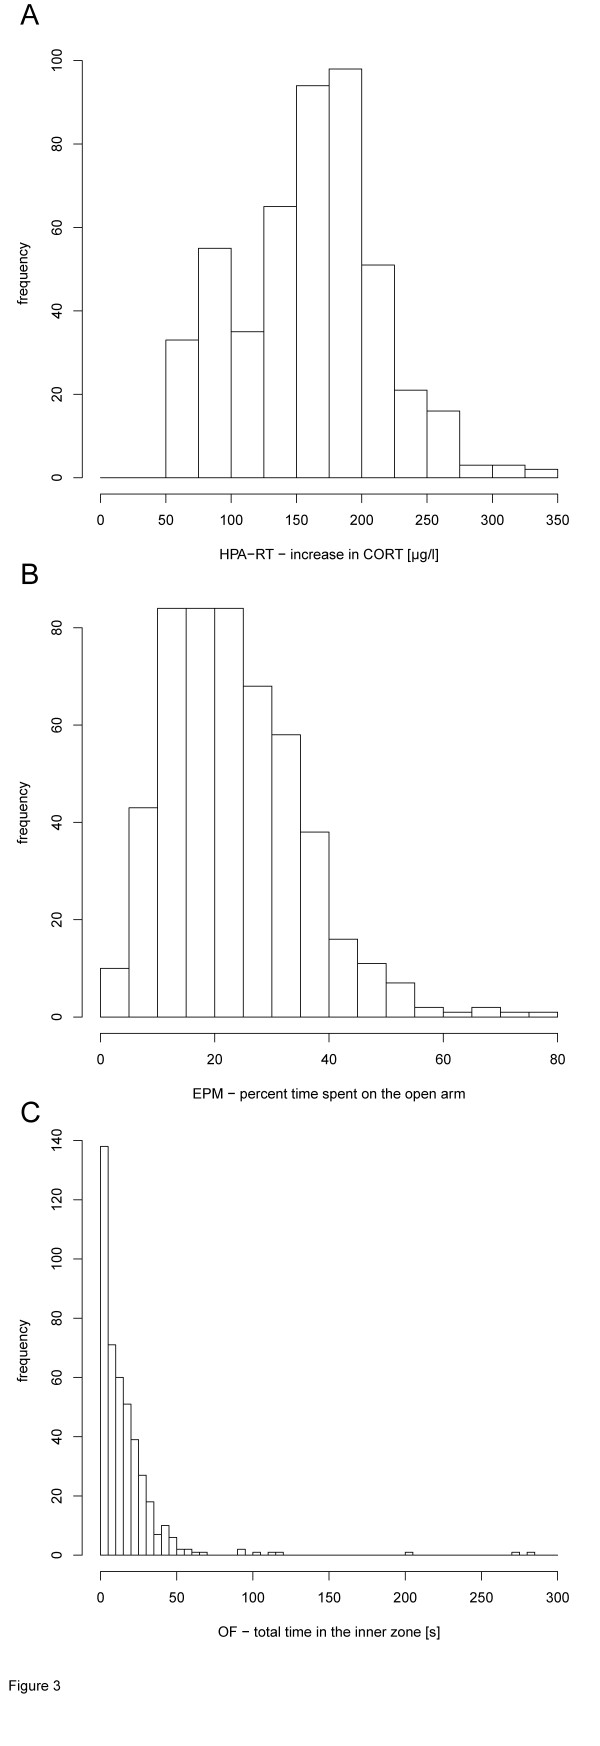
Figure 3.
Histograms of the main phenotypes considered for the F2 mice and the PC analysis. These included (A) the corticosterone (CORT) increase after a 15-min restraint stressor, (B) the percent time spent on the open arm of the elevated plus-maze and (C) the time spent in the inner zone of the open field.

