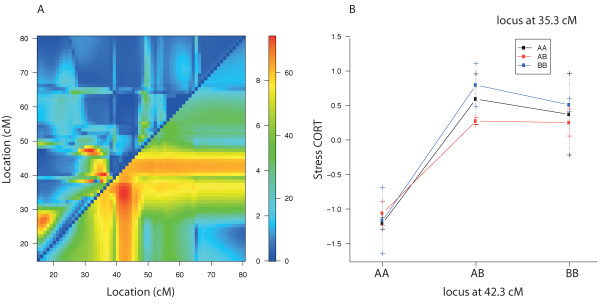
Figure 5.

Two-QTL epistasis on chromosome 3. (A) The upper left triangle contains the LOD scores for the epistasis, e.g., log10 likelihood ratio comparing the full model (two QTLs plus interaction) to the additive model (two QTLs); the lower right triangle contains the LOD scores for the full model, e.g., log10 likelihood ratio comparing the full model to the null model. (B) The phenotype means for each group defined by the genotypes at two epistatic loci.
