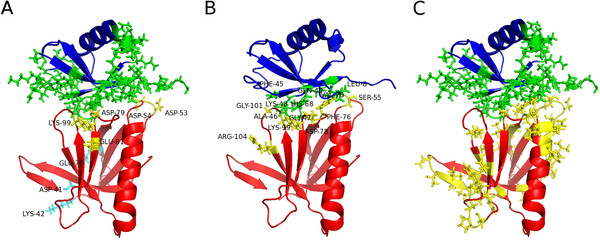
Figure 1.

Mapping of ambiguous interaction restraints. Ubiquitin is coloured in blue and Rpn13 in red. Active residues are labeled and their sidechains are shown. Active residues for ubiquitin are colored in green and for Rpn13 in yellow. (A) Mapping of predicted ambiguous interaction restraints by limited proteolysis/mass spectrometry (ubiquitin interface residues are predicted from CPORT interface predictions). Residues in patch 1 are colored in light blue (D41, K42, E70), residues in patch 2 are colored in yellow (D53, D54, D79, K99). (B) Mapping of interface residues identified by NMR chemical shift perturbations, and (C) mapping of predicted interface residues by CPORT. This figure was generated with PyMOL [32].
