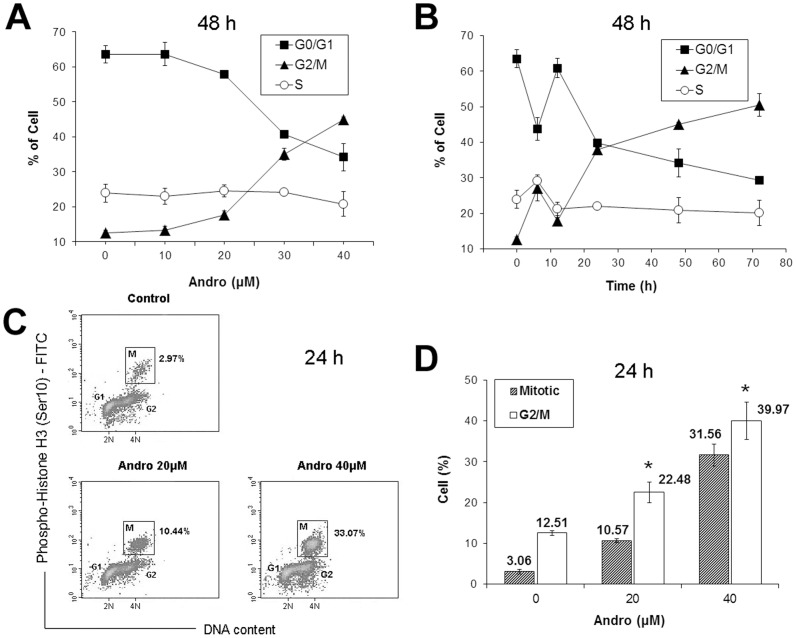
Figure 2. Change in the cell cycle distribution of DU145 cells treated with andrographolide (Andro).
(A) Cells were exposed to 0–40 µM of Andro for 48 h; (B) cells were exposed to 40 µM of Andro for 0–72 h. Cellular DNA was stained with propidium iodide (PI) and analyzed by flow cytometry. The percentage of cells in each specific phase of the cell cycle was calculated with the ModFit program and expressed as the mean ± s.d. (n = 3 or 4). (C&D) Mitotic index of DU145 cells treated with Andro. Cells were treated with 0, 20, and 40 µM of Andro for 24 h and were fixed and stained with anti-phospho-histone H3 (Ser10) antibody, FITC-conjugated secondary antibody and PI, and analyzed by flow cytometry. (C) A representative density plot of the cells labeled with phosphohistone H3 against the DNA content in the cells. Mitotic index (M) of the cell population is indicated in the boxed area. (D) Mitotic index and percentage of G2/M cells after treatment with two different concentrations of Andro expressed as mean ± s.d. (n = 4). * indicates significantly different from the control (p<0.01).

