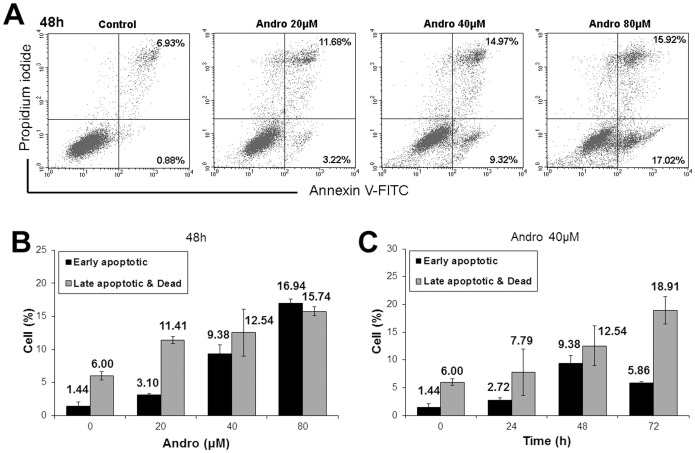
Figure 3. Apoptosis of DU145 cells treated with andrographolide (Andro).
(A&B) After treating for 48 h with 0–80 µM of Andro, the cells were collected and doubly stained with Annexin V-FITC antibody and PI before analyzed by flow cytometry. (A) One set of representative dot plots indicates the percentage of early apoptotic cells (Annexin V-FITC+/PI−, lower right hand panel) and the percentage of late apoptotic and dead cells (Annexin V-FITC+/PI+, upper right panel). (B) The plot of the percentage of early apoptotic and of late apoptotic and dead cells under different Andro concentrations expressed as mean ± s.d. (n = 4). (C) The cells were exposed to 40 µM of Andro for 0–72 h. The plot of the percent of early apoptotic and of late apoptotic and dead cells against the time of treatment expressed as mean ± s.d. (n = 4).

