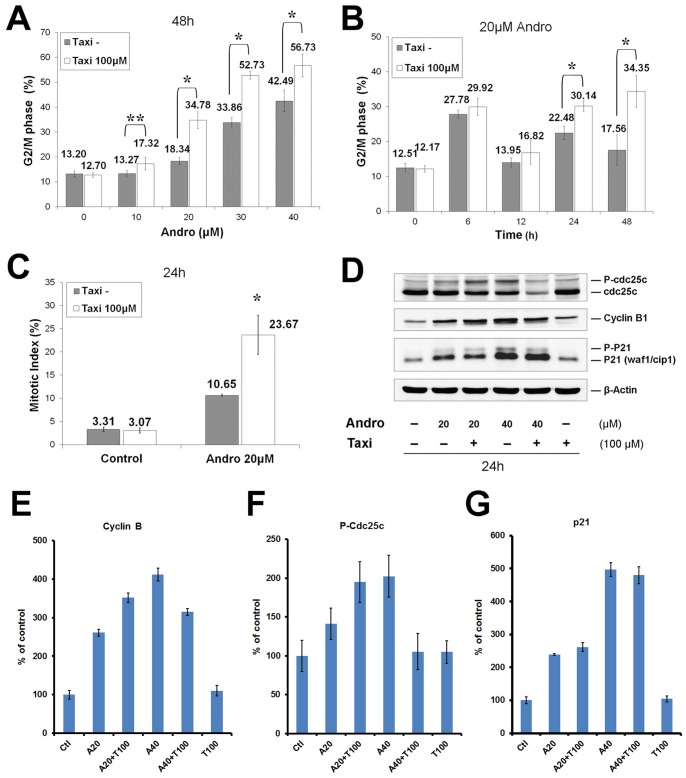
Figure 7. Taxi enhances Andro-induced cell cycle arrest in DU145 cells.
The cells were treated with (A) 0–40 µM of Andro for 48 h (B) 20 µM of Andro for 0–48 h in the presence or absence of 100 µM of Taxi. Cellular DNA was stained with PI and analyzed by flow cytometry. The distribution of the cell cycle was calculated with the ModFit program. Mean ± s.d. (n = 4) of percentage of G2/M cell in the presence of Taxi (100 µM) and in the absence of Taxi (Taxi−) were compared. * indicates significant difference between two groups, *p<0.01, **p<0.05. (C) The cells were treated with 20 µM of Andro for 24 h in the presence or absence of 100 µM of Taxi. The treated cells were fixed and doubly stained with anti-phosphohistone H3 (Ser10) antibody and PI, and analyzed with flow cytometry. Mitotic index expressed as mean ± s.d. (n = 3 or 4) in the Taxi− and Taxi 100 µM groups were compared, *p<0.01. (D) Lysates from 40 µg of the cells that had been treated with the indicated Andro and Taxi for 24 h, and then was immunoblotted against antibodies of phosphorylated Cdc25c, cyclin B1, p21, and actin as control. Data are representative of three independent experiments. (E–G) Quantification of the signals from the immunoblots of the cyclin B (E), p-Cdc25c (F), and p21 (G) were plotted under different indicated conditions. The values in the plots are the mean ± s.d. of three independent experiments.

