
Figure 2. Shows a representative Western blot analysis of HSP 70 expression in placenta of a patient (non-labor) and a patient in labor (n = 6 patients in each group for entire study).
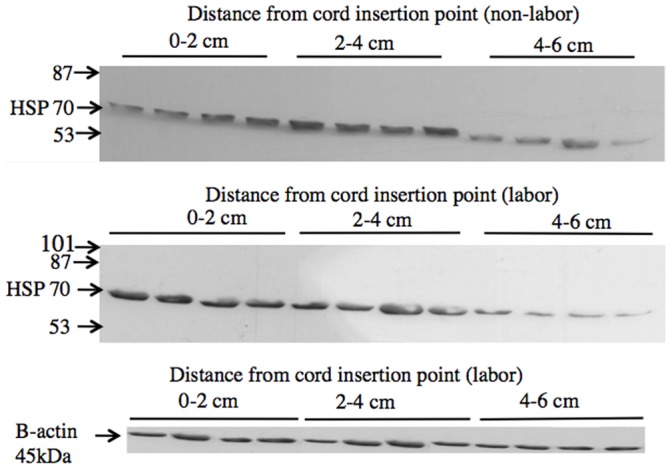
Samples are grouped according to distance sampled from cord insertion point. Four samples were obtained within each zone (see Figure 1). Molecular weight markers (kDa) are indicated by arrows. Also shown is a representative β-actin loading control for the gel above showing equal protein loading.