
Figure 8. Shows HSP 70 expression in three different placenta zones for all patients in the labor group (n = 6 patients) (upper panel).
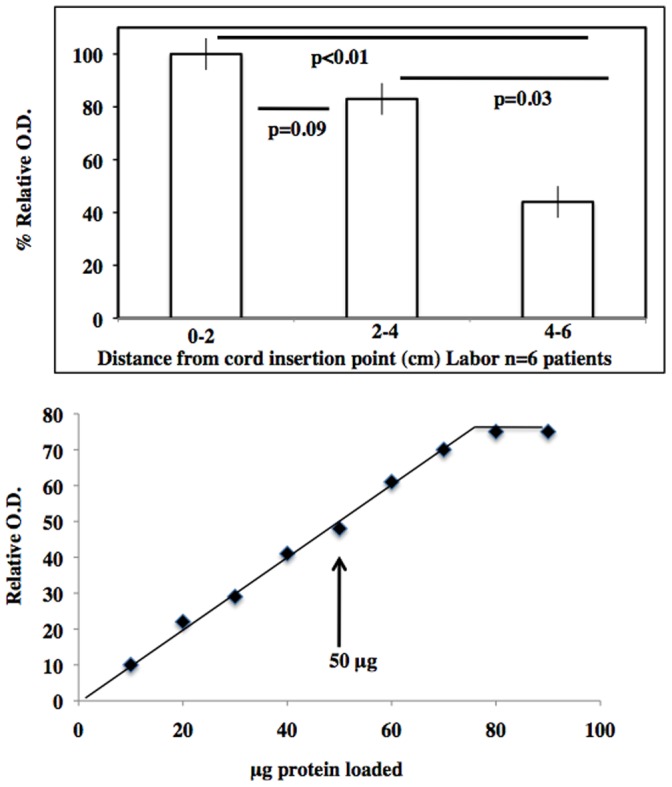
Quantification was performed using the BioRad documentation ECL imager system. The lower panel shows the relationship between protein loading and signal obtained.