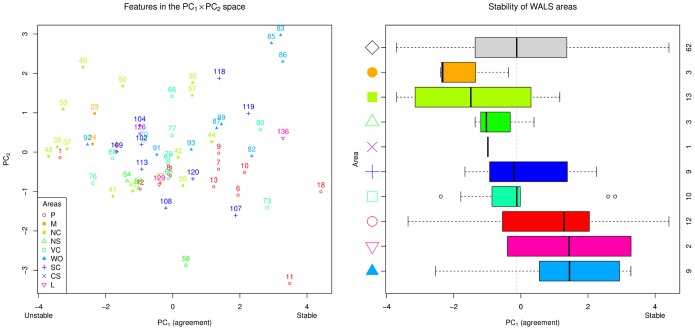
Figure 3. Distribution of features’ stabilities across methods.
Left panel: a ll shared features (given by their numeric WALS unique ID; see Table 1) plotted on the  . Right panel: the distribution of the stability across the WALS areas, with the number of features of each type shown on the right.
  represents the strong inter-method agreement and varies from the unstable (left) to stable (right); the actual scales of the axes are arbitrary. The colours and symbols represent the WALS areas (see Table 1 for details), with the open diamond
  representing all shared features together. The results excluding the outlier methods are extremely similar.

