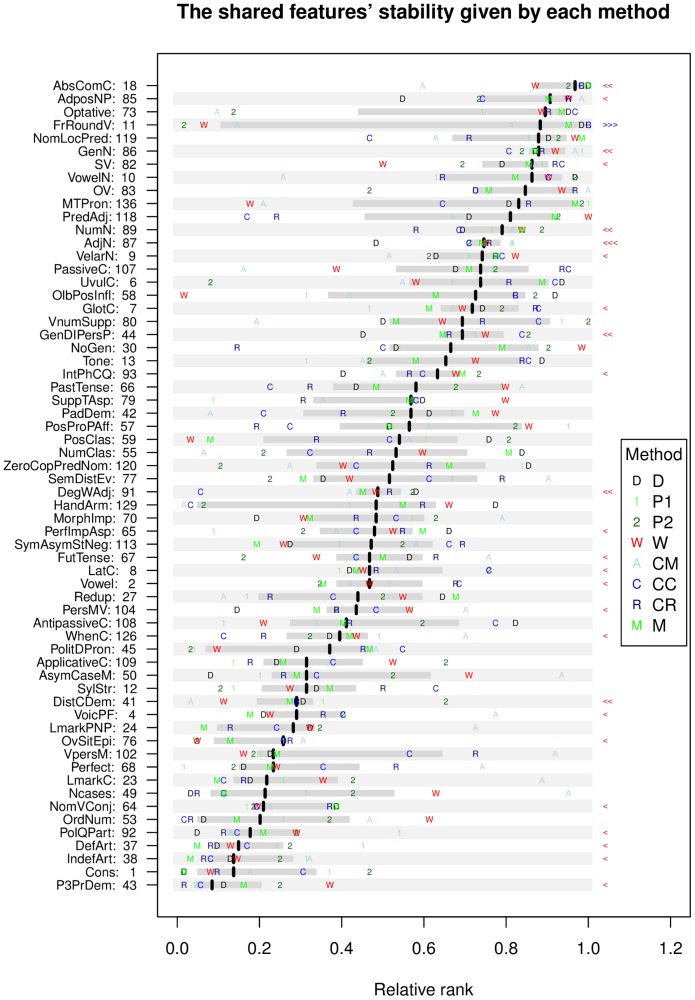
Figure 4. The features’ stabilities.
The stabilities (as relative ranks from 0.0 = most unstable to 1.0 = most stable) of the shared features as estimated by all methods. Shown are the median stability (black thick lines), the interquartile range (IQR; light gray) and the individual method estimates (D, 1, 2, W, A, C, R, and M – see legend for details). The features with a significantly smaller or larger IQR than expected by chance are marked with red “<” and blue “>” symbols respectively on the right-hand side of the figure, with the number of symbols being one for  , two for
  and three for
  ; please note that this is before the multiple testing correction, after which only the features with
  , 11 and 87, survive (see text for details). The features are represented by transparently abbreviated names derived from their full WALS names (see Table 8) and their WALS unique IDs.

