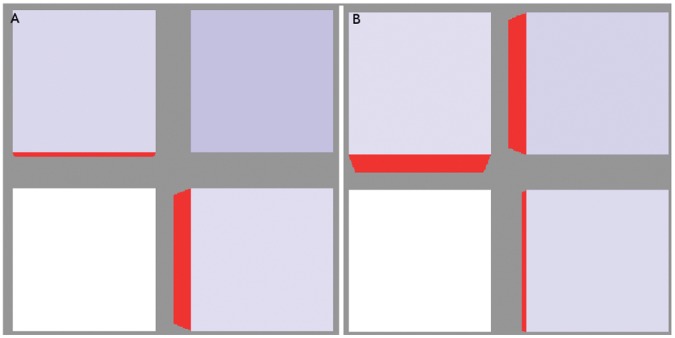
Figure 4. The two mechanisms of competition.
(A) The auxin production rate in the bottom right cell has been increased to 2 µmolhr− 1 while the other auxin-producing cells both retain a production rate of 0.4 µmolhr− 1. This enhanced auxin throughput, via the increased PIN levels, maintains a low auxin concentration (0.4279 µmol µm− 3) that, paradoxically, gives it the majority of the diffusive transport. Since PIN in the top right cell (A = 0.3727 µmol µm− 3) is too low to dominate transport this cell ends up receiving the majority of its ux. (B) Here it is the top right cell that has the enhanced auxin production (also 2 µmolhr− 1). In this case the initially tiny difference in PIN concentration between the two walls becomes very large, indicating that the flux through this cell is strong enough to make different PIN concentrations the stable configuration.

