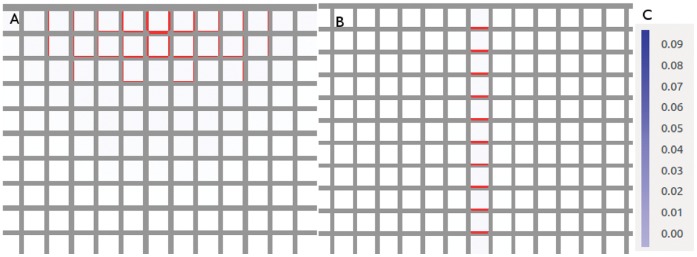
Figure 5. Source-driven systems.

These simulations are run on a square grid much larger than shown here (see other figures with square grids) but we have zoomed in on the PIN distribution around the source for clarity. The top-centre cell of the grid is a source. (A) Linear feedback ( = 1.0). (B)
  = 1.5. This result is representative of similar simulations for any
  . The length of the vascular strand is sensitive to changes in the background auxin degradation and the strength of the source. (C) The colour bar indicates the auxin concentration in µmol
µm−
3 in this and all remaining simulations.
