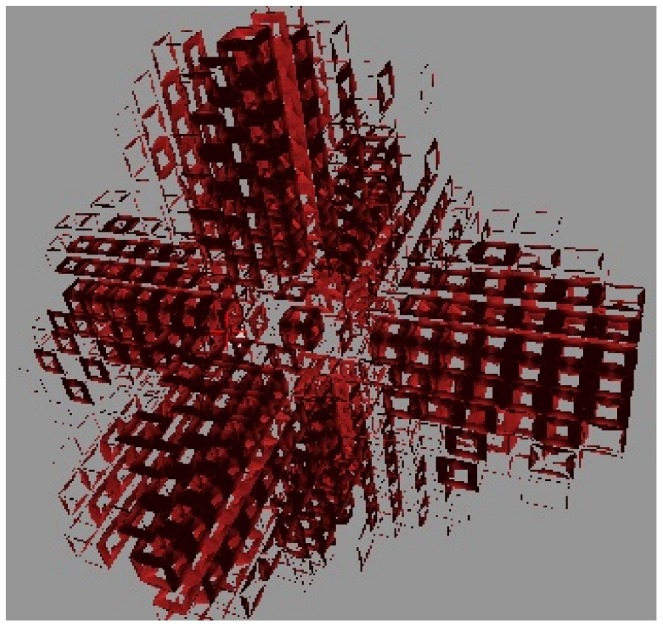
Figure 10. PIN distribution for a three dimensional sink-driven system.

The display of cells has been repressed for the sake of clarity. This snapshot was taken while the simulation was still incomplete but one can already see the excessive branching from the initial veins. This simulation went on to almost fill the entire tissue with sub-lateral veins (not shown). the sink is in the exact centre of the tissue. Similar results were found for the competitive model.
