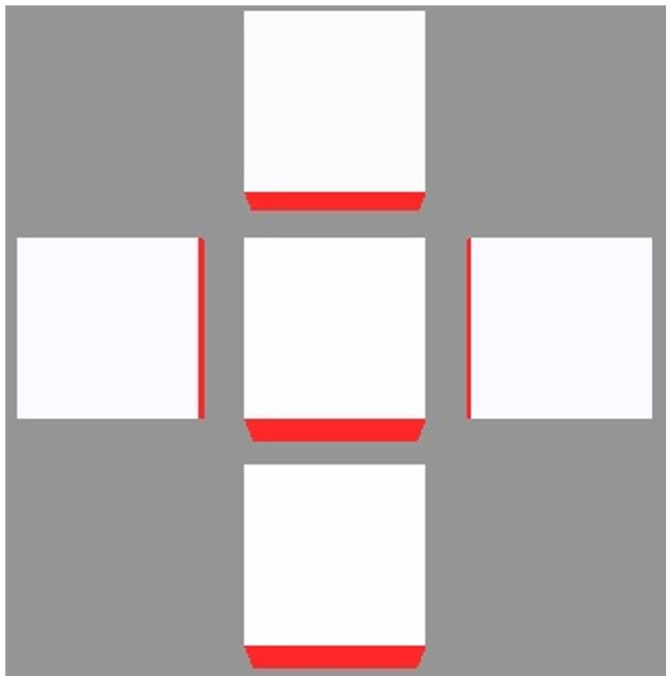
Figure 14. Demonstration that available flux alone accounts for PIN generation.

The centre cell is due to be the next cell in a growing vein, represented by the perfect sink at the bottom with the strong PIN expression. The top cell has higher auxin generation than the other two, and the final PIN concentrations are proportional to the square of the auxin generation when  = 2. Thus conformity to the polar-in requirement is largely unaffected by dynamics within the receiving cell.
