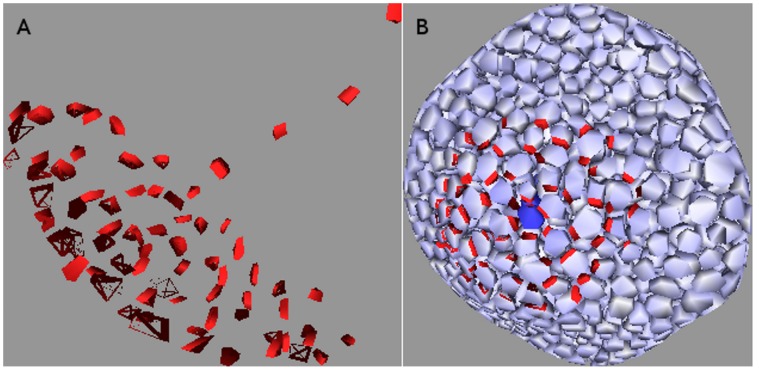
Figure 18. Competitive model with  = 1∶5 on digitized oral meristem.
The cells are repressed for clarity in the left-hand picture. A small region on the surface produces auxin like an L1, with its cells pointing PIN toward the primordium at the centre, while a canalized mid-vein grows into the interior. The right-hand side indicates a rise in auxin is visible at the primordium. Auxin production is limited to the L1 with the value α = 0.1 mol µm− 3 hr− 1. Auxin degradation in the L1 is β = 1.0 hr− 1, while that in the interior is β = 0.4 hr− 1. Cell volumes range from about 95 to 300 µm 3 with wall areas ranging from six to about sixty µm 2.

