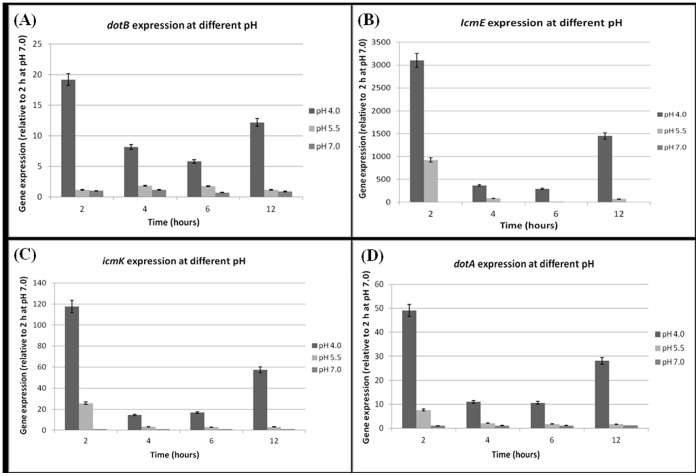
Figure 3. Expression profiles of dot/icm genes throughout P. salmonis growth kinetics at different pHs in MC1 medium.
Gene expression was determined by qRT-PCR, using relative quantification. A: dotB gene expression number; B: icmE gene expression; C: icmK gene expression; D: dotA gene expression. Gene expression was normalized by the use of ITS like a housekeeping gene. Two hours of growth at pH 7.0 was used as calibrator (value = 1) for all genes. The figure shows that all genes were notably over-expressed at pH 4.0, particularly at 2 hours of incubation.

