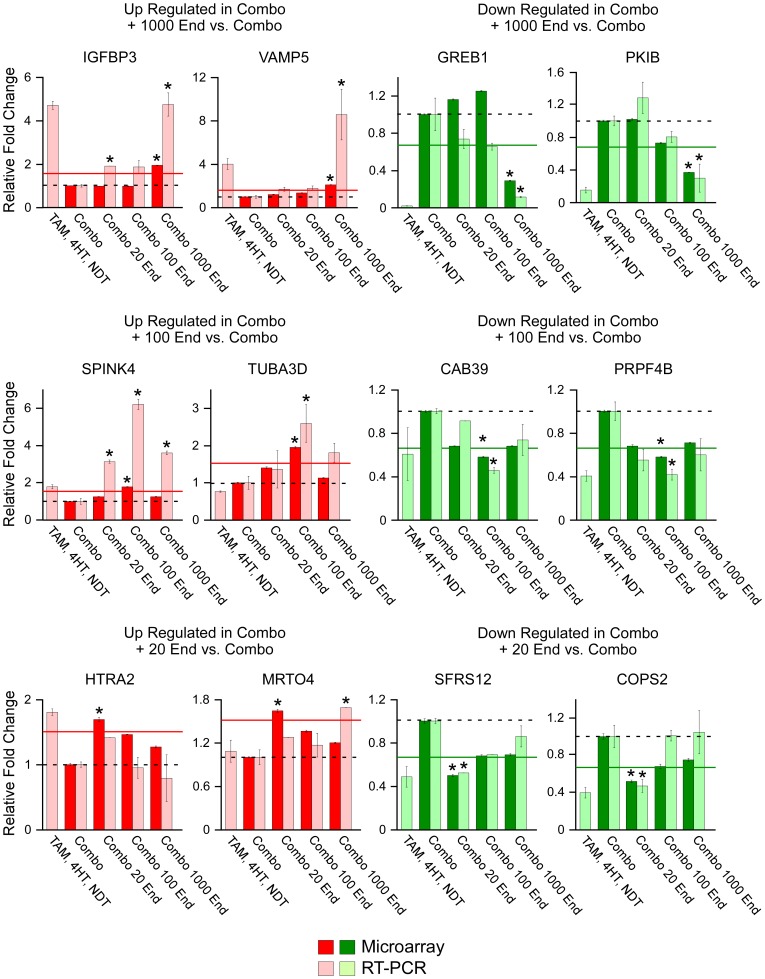
Figure 7. Real-time PCR confirmation of randomly selected genes whose expression levels were either increased (red) or decreased (green) by a specific endoxifen concentration.
Genes whose expression levels were determined to be specifically increased (red) or decreased (green) by only one of the three endoxifen concentrations were randomly selected for confirmation of the microarray data. Darkly shaded bars depict relative fold changes from E2 (10 nM), TAM (300 nM), 4HT (7 nM) and NDT (700 nM) treated cells (combo/dashed line) as detected by microarray analysis while lightly shaded bars depict fold change as detected by RT-PCR analysis. Solid lines represent the 1.5 fold cut-off used in the microarray analysis. Data represent the mean ± the standard error of three independent treatments. Asterisks denote values with significant differences at the P<0.05 level (ANOVA) relative to combo treated controls which also met the 1.5 fold cut-off parameter used in the microarray analysis.

