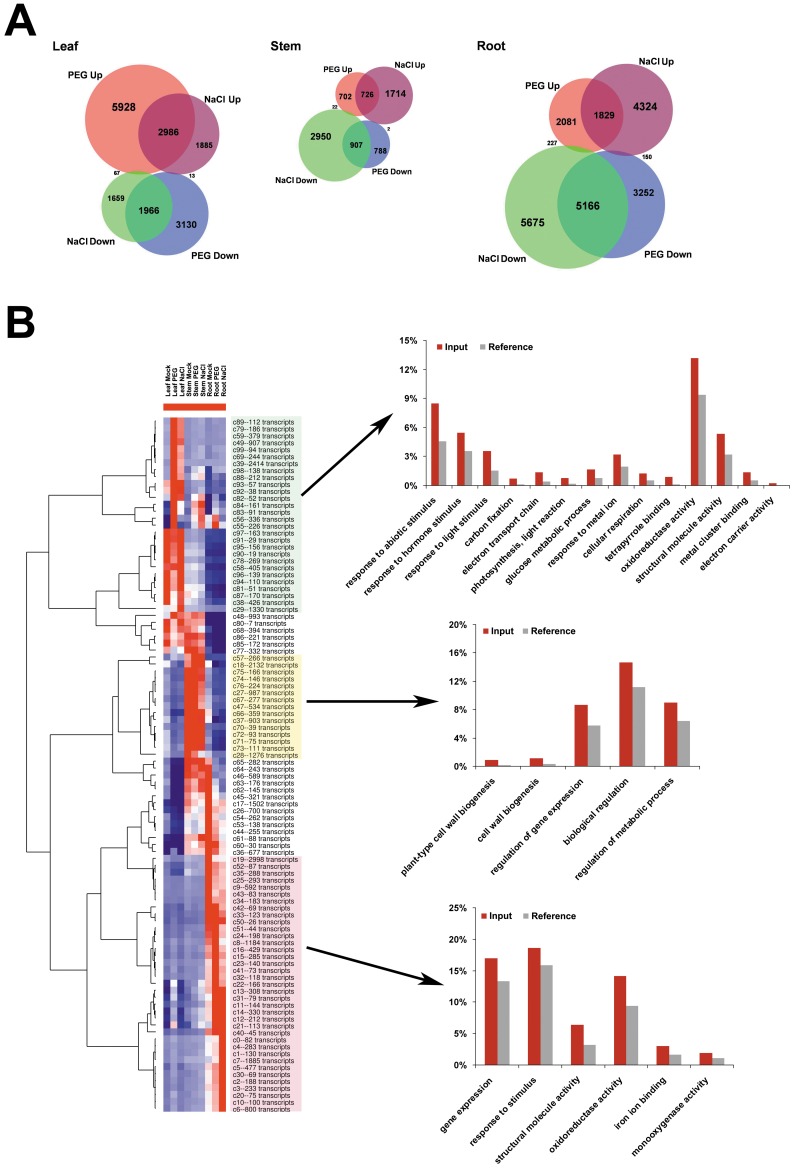
Figure 3. Summary of the differential expression transcripts across cotton tissue samples and treatments.
A: Venn diagrams illustrate the differential expression transcripts under PEG and NaCl treatment in root, stem, and leaf samples. The red and blue colors represent the up-regulated and down-regulated transcripts under PEG treatment, respectively. The purple and green colors represent the up-regulated and down-regulated transcripts under NaCl treatment, respectively. B: Cluster and gene ontology (GO) analysis of the transcripts’ response to PEG or NaCl treatments in different cotton tissues. The overview hierarchical cluster result of the centroids of SOM cluster (listed in Fig. S4), the red (high) and blue (low) colors represent the relative expression level across the samples. The marked centroid groups represent the transcripts in these clusters preferentially expressed in the leaf (marked in light green background), stem (light yellow background), or root (light purple background) tissue. In the comparison of the enriched GO terms in the transcripts preferentially expressed in the leaf, stem, or root tissue, the red bars represent the percentage of transcripts belonging to enriched terms in the query list (Input), whereas the gray bars represent the percentage in all transcripts (Reference).

