
Figure 7. Macroscopic evaluation scoring for neocartilage surface and histological evaluation of regenerated osteochondral tissues.
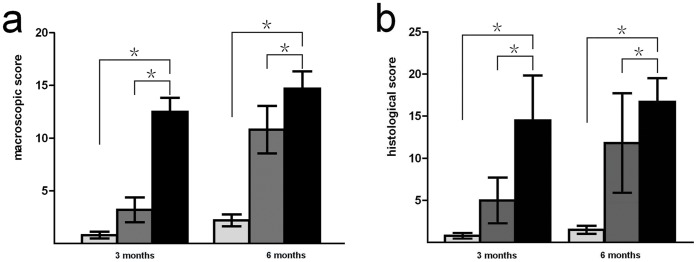
(A) Macroscopic score for neocartilage surface. (B) Histological score for regenerated osteochondral tissue. At 3 and 6 months after implantation, experimental group scores were significantly higher than both control and non-treatment group scores (P<0.05). (Black bars represent the experimental group, gray bars represent the control group, light gray bars represent the non-treated group. *p<0.05, significance between the two groups.).