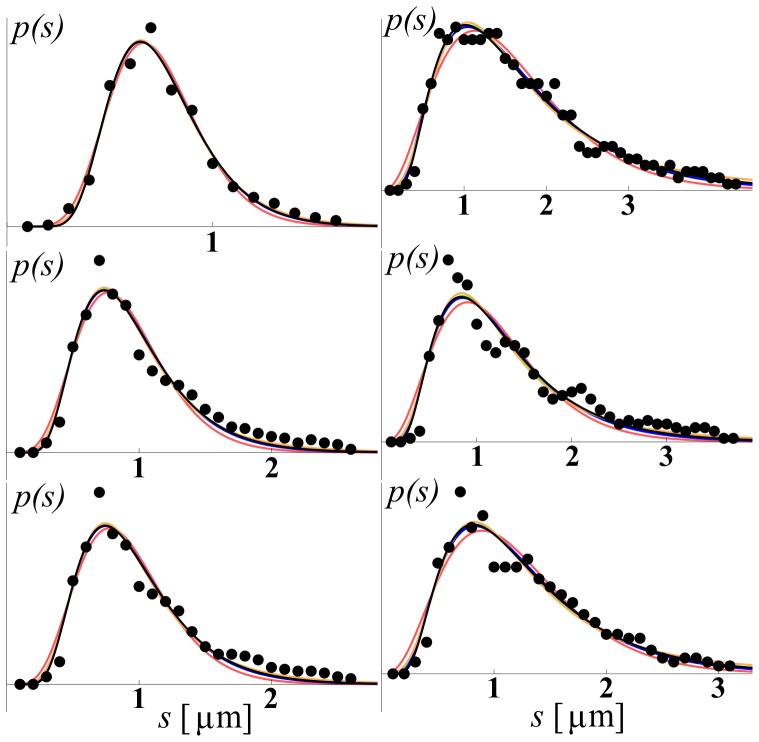
Figure 1. Examples of the model fits obtained using EMD1 data [1] (solid circles).
The fitted models are displayed as follows: IUBD (black), TRD (orange), GD (red), LND (green), PMD (blue). The x-axis designates the size of the axon in microns ( ); the y-axis is in arbitrary units. The complete set of fits is provided in the supplementary material, together with the anatomical information about each individual data set.

