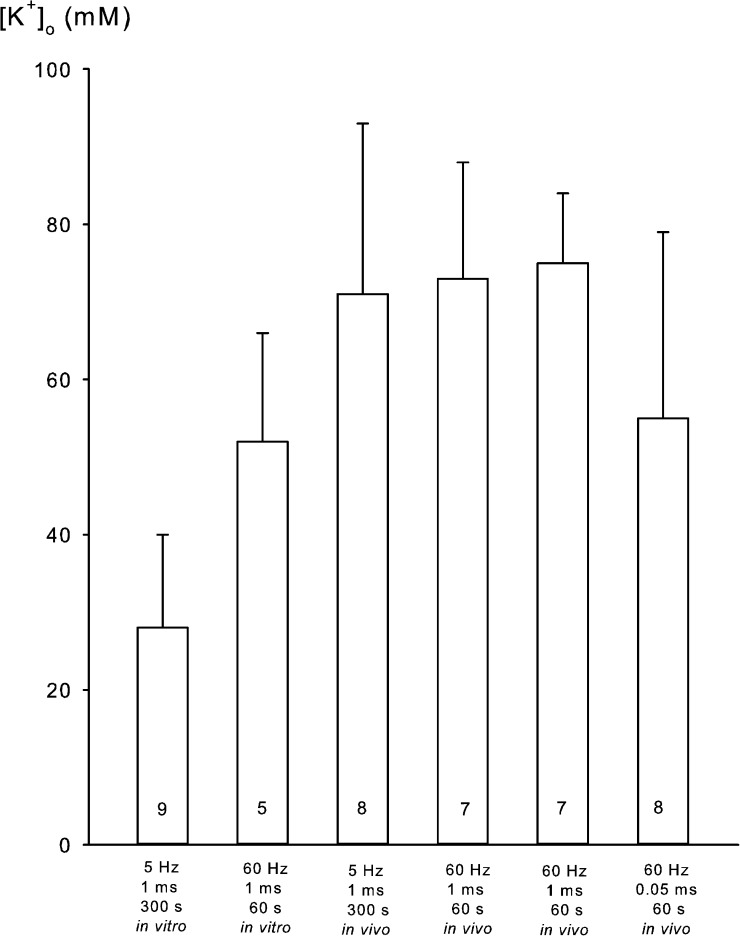
Figure 2.
Stimulation-induced expected rise in [K+]o in EDL muscles in six different experiments. Experiments were performed as described in Materials and methods and the legends to Tables 1 and 3. Mean values are obtained by dividing the net loss of K+ by the extracellular space measured in the stimulated muscles in vitro (0.194 ml/g wet wt) and in vivo (0.177 ml/g wet wt). Values are given with bars denoting SEM and the number of muscles inside the columns. The frequency and duration of stimulation are given below each column.

