Figure 3.
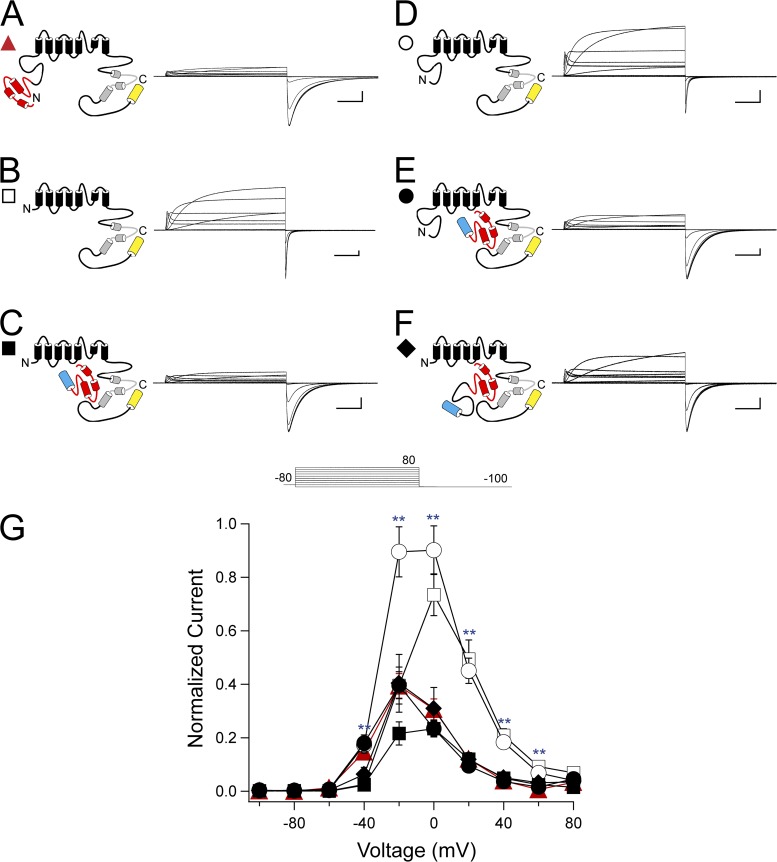
eag domain regulation of hERG rectification. (A–F) Channel schematics and two-electrode voltage-clamp recordings of a family of currents from hERG (A), hERG ΔN (B), hERG ΔN plus N1–135 (C), hERG Δeag (D), hERG Δeag plus N1–135 (E), and hERG ΔN plus N1–354 (F). Currents were elicited using the pulse protocol shown. Calibration bars, 1 µA and 200 ms. (G) Steady-state I-V curves derived from the currents shown in A–F by normalizing the peak outward current at the end of each depolarizing step to the extrapolated peak tail current at −100 mV and plotting versus voltage. Error bars are the SEM and are within the points if not visible. n ≥ 9 for each construct. **, P < 0.01 versus hERG.

