Figure 8.
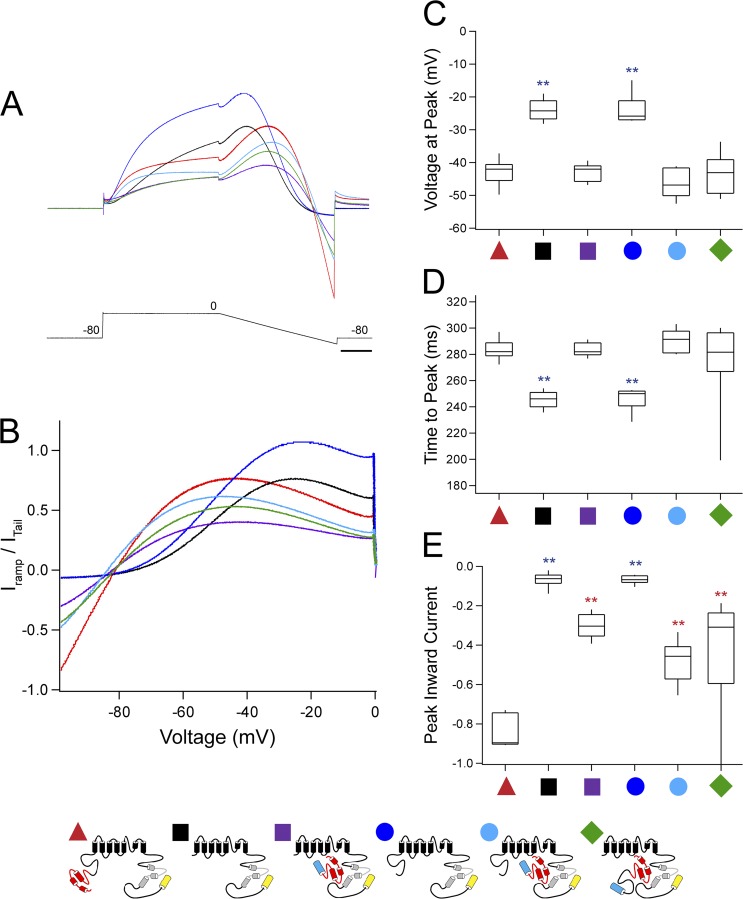
The eag domain regulates the timing of the peak hERG resurgent current. (A) Representative current recordings of hERG (red), hERG ΔN (black), hERG ΔN plus N1–135 (purple), hERG Δeag (blue), hERG Δeag plus N1–135 (light blue), and hERG ΔN plus N1–354 (green) in response to a dynamic ramp clamp. Currents were normalized to the extrapolated peak tail at −100 mV (see Materials and methods). Bar, 50 ms. (B) Graph of the normalized current from A versus the voltage during the current ramp. (C) Box plot of the voltage at the current peak in A and B for the constructs indicated. (D) Box plot of the time to the current peak in A and B for the constructs indicated. (E) Box plot of the peak inward current at −100 mV derived from A and B for the constructs indicated. The middle line of the box is the mean, the top and bottom are the 75th and 25th percentiles, and the vertical lines indicate the 90th and 10th percentiles. n ≥ 10 for each construct. **, P < 0.01 versus hERG and versus hERG and hERG ΔN.

