Figure 2.
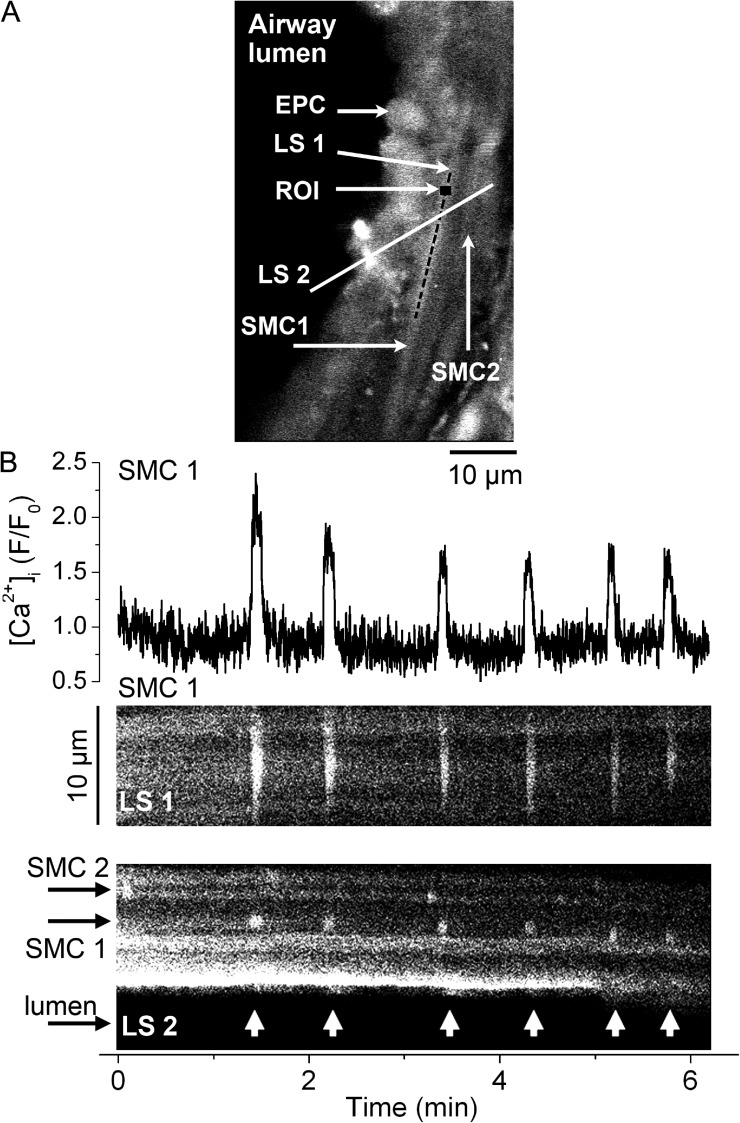
Simultaneous Ca2+ signaling and contraction in airway SMCs induced by phorbol esters. (A) Fluorescence confocal image of an airway region in a lung slice showing epithelial cells (EPC) lining the airway lumen (left, black area) and the underlying SMCs (SMC1 and SMC2). A small (7 × 7–pixel) ROI within SMC1 and two lines (LS1 and LS2) indicate the areas selected for the representative fluorescence trace and line scans presented in B. (B; top) Fluorescence (F/F0) trace showing the Ca2+ oscillations stimulated by 10 µM PMA (added 30 min before the recording started) in a single airway SMC. (B, middle) Line-scan analysis from the longitudinal axes of the SMC1 (LS1) shows the propagation of the Ca2+ oscillations along the SMC as Ca2+ waves (near-vertical white lines). (B; bottom) Line-scan analysis from an area (LS2) across SMC1, SMC2, epithelial cells and part of the airway lumen shows the Ca2+ oscillations in the SMCs (short vertical white lines) and transient displacements of the epithelial cells toward the airway lumen (arrow heads) caused by SMC twitching occurring concomitantly with the Ca2+ oscillations in SMC1. Data are representative of six experiments in lung slices from three mice. A time-lapse movie showing the Ca2+ oscillations stimulated by PMA in airway SMCs is shown in Video 2.

