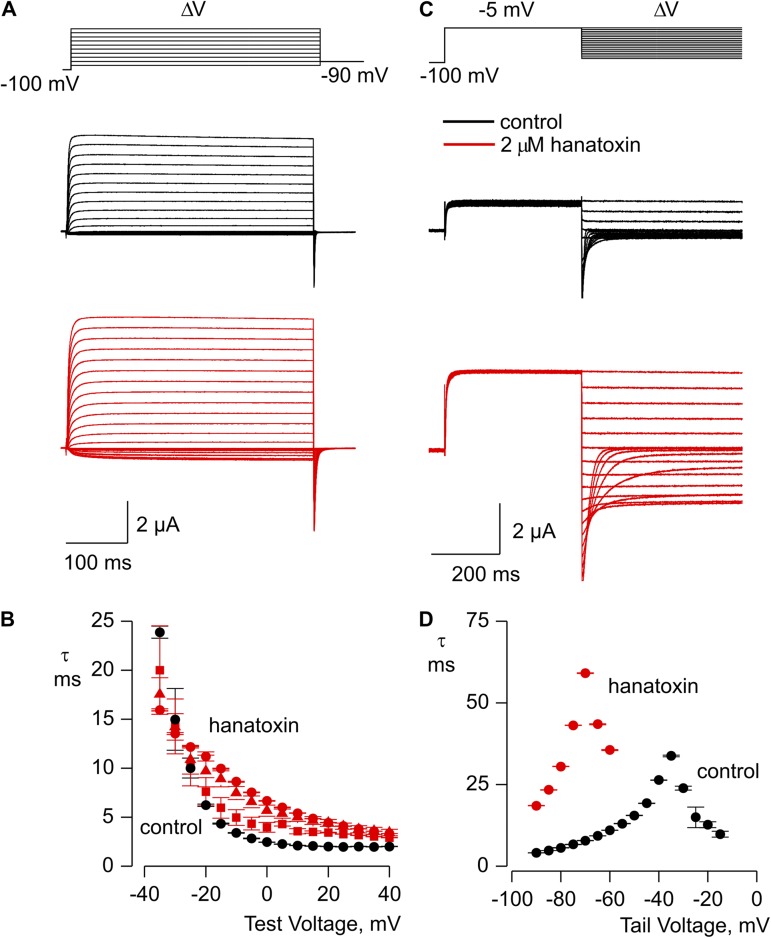
Figure 4.
Influence of hanatoxin on the kinetics of activation and deactivation for the Shaker Δ3 Kv channel. (A) Kinetics of channel opening in the absence (black traces) or presence (red traces) of 2 µM hanatoxin. (B) Mean time constant (τ) from single-exponential fits to channel activation in the absence (black) or presence of 100 nM (red squares), 200 nM (red triangles), and 2 µM (red circles) hanatoxin. (C) Kinetics of channel closing in the absence (black traces) or presence (red traces) of 2 µM hanatoxin. (D) Mean time constant (τ) from single-exponential fits to channel deactivation in the absence (black circles) or presence of 2 µM hanatoxin (red circles). The external solution contained 50 mM Rb+, and error bars indicate SEM (n = 3).

