Figure 4.
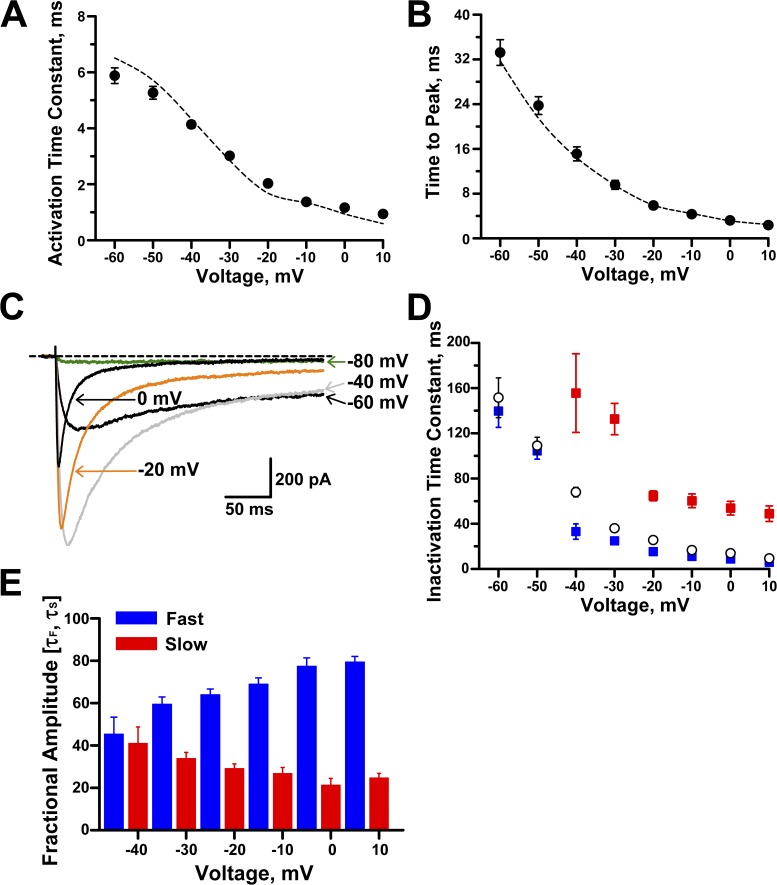
Effects of intracellular GTPγS on NaV1.9 kinetics. (A) Time constants for activation in the presence of intracellular GTPγS (n = 13–14). (B) Time to peak current in the presence of intracellular GTPγS (n = 21). Dotted lines illustrate data for control solution (from Fig. 2). (C) Averaged whole-cell NaV1.9 currents recorded during 300-ms pulses to −80, −60, −40, −20, and 0 mV. Dotted line indicates the zero current level (n = 10). (D) Inactivation time constants (fast, blue; slow, red) recorded in the presence of intracellular GTPγS (n = 8–14). Inactivation time constants for control pipette solution (open circles; n = 13–17) are also shown (from Fig. 2 D). (E) Fractional amplitudes for inactivation time constants determined in the presence of intracellular GTPγS for −40 to 10 mV (n = 8–14). Data are represented as means ± standard error of the mean.

