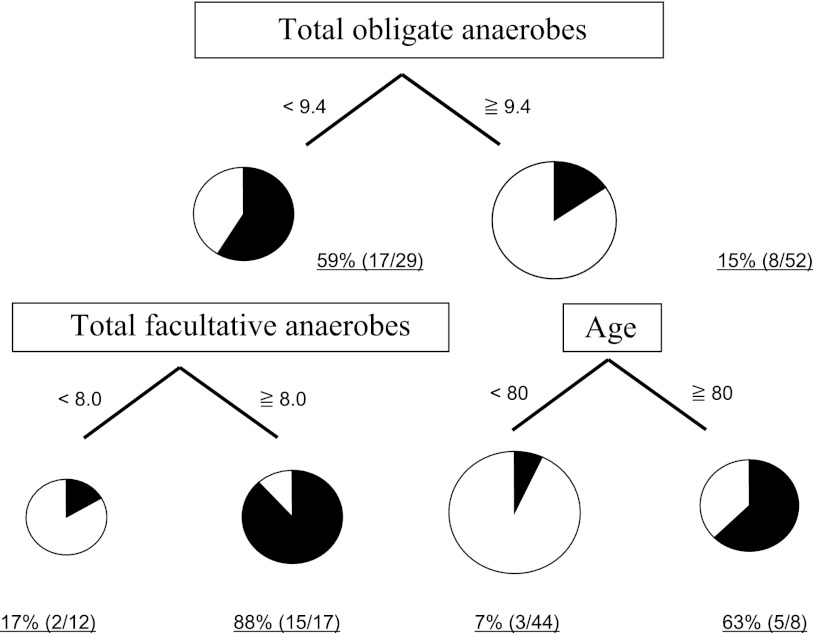
Fig. 1.
Mortality partitioned by total obligate anaerobes, total facultative anaerobes, and age using CART. Mortality is partitioned by the number of total obligate anaerobes 9.4 (log10CFU/g). In addition, mortality is partitioned 88 and 17 % by the number of total facultative anaerobes 8.0 (log10CFU/g). CART classification and regression trees, CFU colony-forming unit

