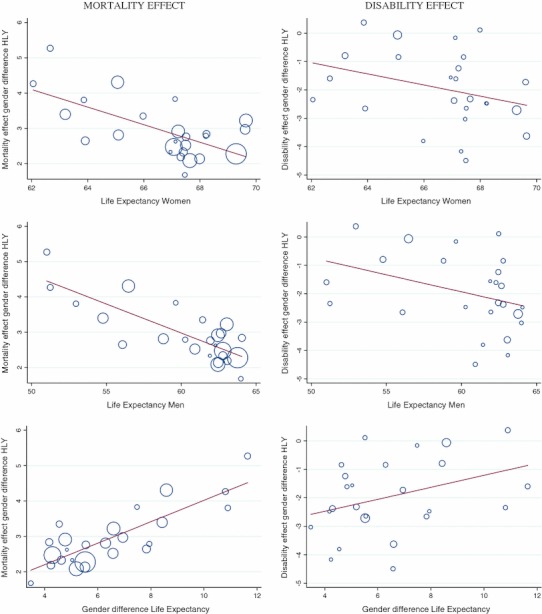
Fig. 2.

Association between the life expectancy and decomposition indicators by kind of effect of the gender differences (females − males) in healthy life years (HLY) at age 15 years, EU-25, 2006. Meta-regression (univariable) line graph of fitted values. Circles represent the estimate (mortality or disability effect) from each country, with circle size depending on the inverse of the within-country variance
