
Fig. 10.
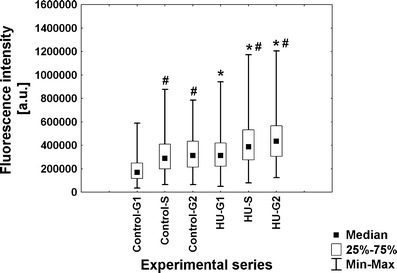
Median immunofluorescence intensity (a.u. arbitrary units) evaluated following detection of histone H4 acetylated Lys5 in seedlings incubated in H2O and HU. Successive phases of the cell cycle in the control plants denoted as Control-G1, Control-S, and Control-G2, while in seedlings incubated in 2.5 mM HU (24 h) denoted as HU-G1, HU-S, and HU-G2. Statistical significance (Kruskal–Wallis test): *p < 0.001 control-G1/HU-G1, control-S/HU-S, control-G2/HU-G2; # p < 0.001 control-G1/control-S, control-G1/control-G2, HU-G1/HU-S, HU-G1/HU-G2