
Fig. 8.
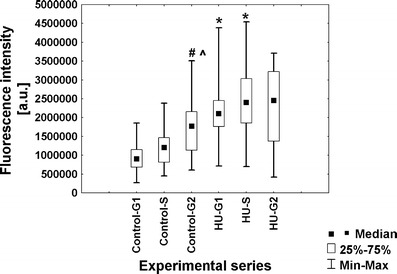
Median immunofluorescence intensity (a.u. arbitrary units) evaluated using anti-large subunit of RNA polymerase II (POLR2A) antibodies in seedlings incubated in H2O and HU. Successive phases of the cell cycle in the control plants denoted as Control-G1, Control-S, and Control-G2, while in seedlings incubated in 2.5 mM HU (24 h) denoted as HU-G1, HU-S, and HU-G2. Statistical significance (Kruskal–Wallis test): *p < 0.001 control-G1/HU-G1, *p < 0.001 control-S/HU-S; # p < 0.001 control-G1/control-G2; ^ p = 0.04 control-S/control-G2