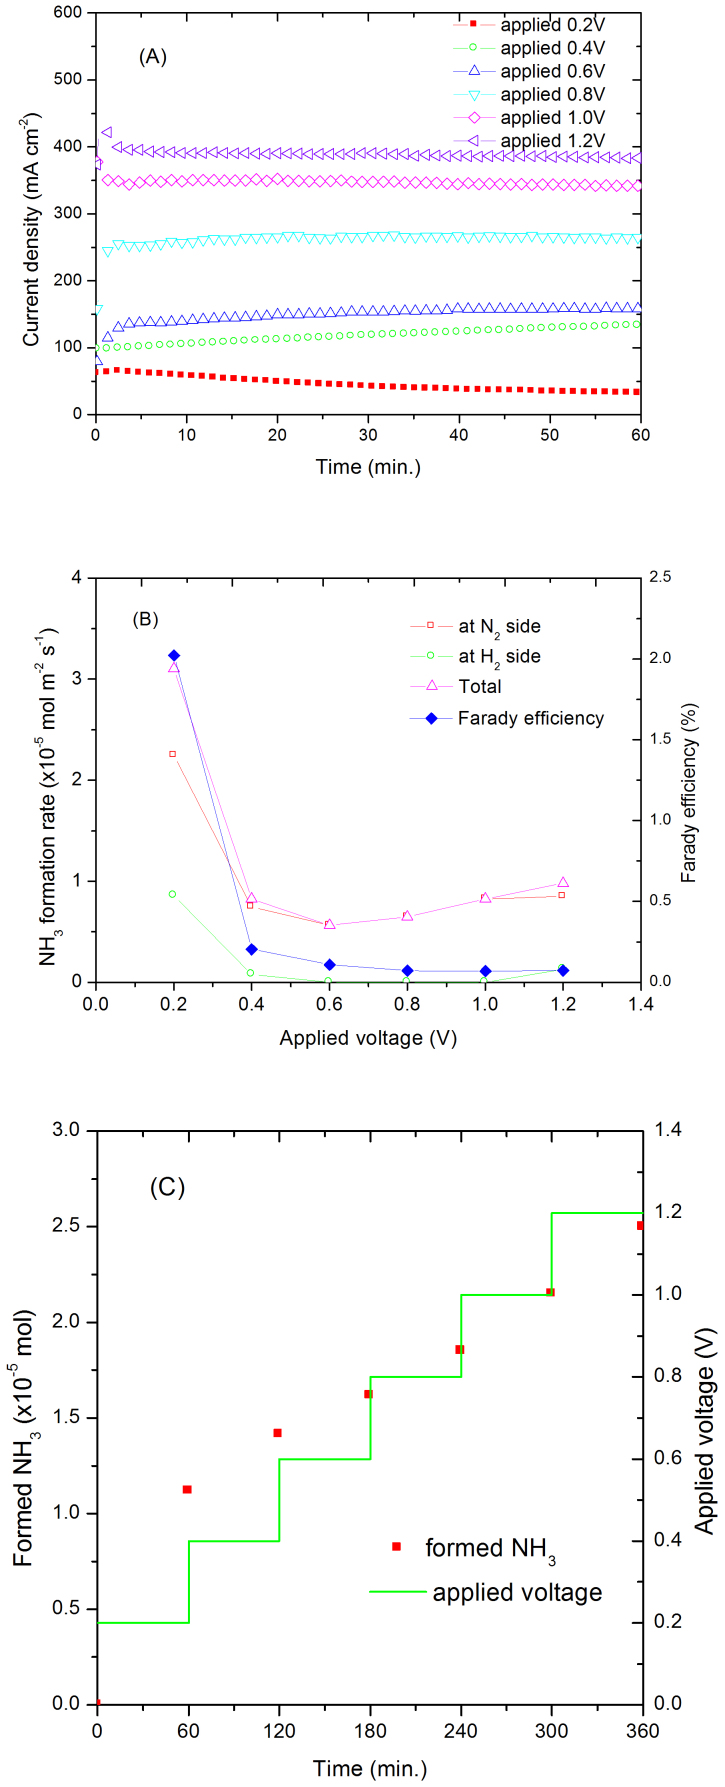
Figure 3.
(A) Current density of a N2, Pt | Nafion 211 | Pt, H2 cell under different applied voltages. Cathode was supplied with N2, anode was supplied with H2. (B) The ammonia formation rate at N2 and H2 sides, total ammonia formation rate and Faraday efficiency. (C) The relationship between formed NH3 and time of a N2, Pt | Nafion 211 | Pt, H2 cell under different applied voltages. Cathode was supplied with N2, anode was supplied with H2.

