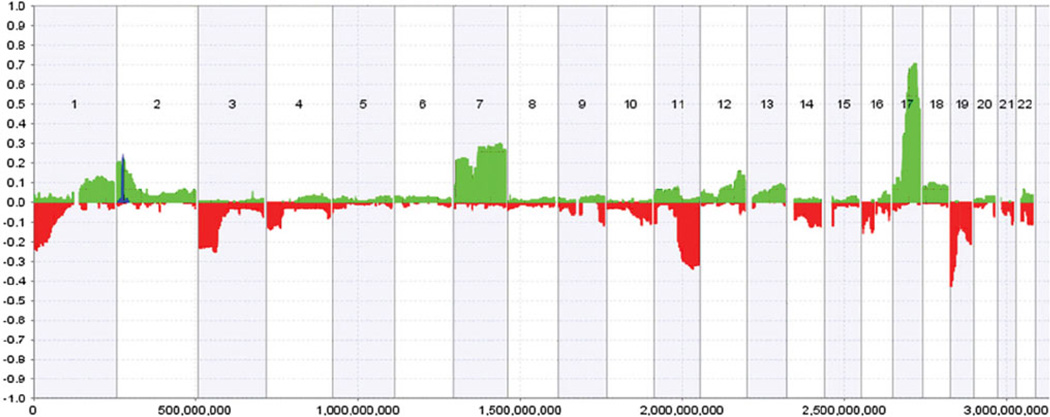
Fig. 2.
DNA copy number alterations from 160 primary neuroblastoma tumors across the genome. Regions of hemizygous loss (red bar) and hemizygous gains (green bar) are plotted for each autosome with the observed frequency (%) of each aberration detected in the tumor series plotted on the Y axis. The frequency of MYCN and ALK amplifications is also plotted (blue). Figure taken from [78]

