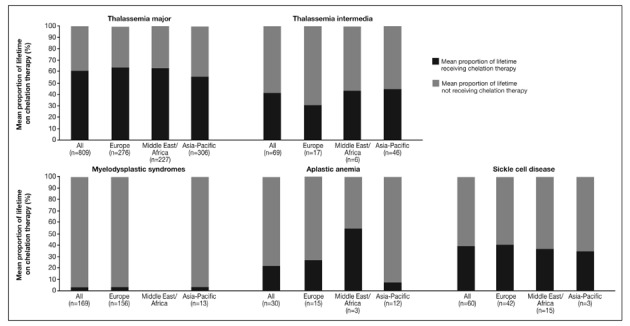
Figure 3A.

Mean proportion of lifetime on chelation therapy* for patients enrolled in the EPIC study included in these analyses.
*Determined by the number of years the subject had already received chelation therapy divided by age at screening; regular or intermittent transfusions were not differentiated in the protocol.
