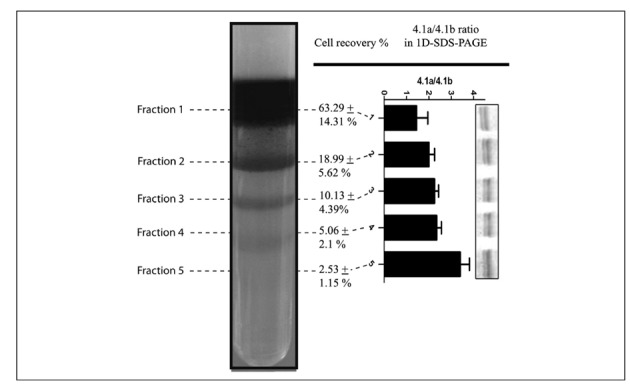
Figure 1.

Percoll density gradient of freshly drawn, leucocyte-filtered, RBC concentrates. Five distinct subpopulations are visible, which are numbered from top to bottom. The gradient was prepared by stacking layers of different densities, in agreement with Bosch et al.28: 1.096 g/mL, 1.087 g/mL, 1.083 g/mL, 1.080 g/mL and 1.060 g/mL. Percentages of cell recovery are reported for each fractions as means+SD (total=100%). In the right panel, the graph reports densitometric analysis for the band 4.1a/4.1b ratio from the 1D-GE runs for each distinct subpopulation.
