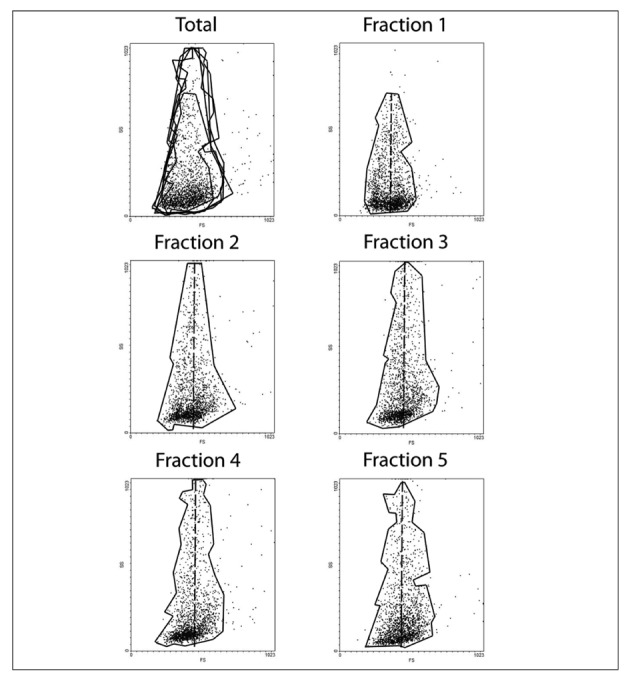
Figure 2.

Flow cytometry analysis representing forward scattering (FS) and side scattering (SS) on the x and y axis, respectively, for the total red blood cell population (upper left frame) and for each one of the five fractions, as labelled. Each subpopulation has been delimited into a shape enclosing >95% of the counted events, and then superimposed in the frame labelled Total (upper left corner). Fractions 2 to 5 showed greater SS in comparison to fraction 1. The core of events is counted with a homogeneous distribution for fraction 1 as far as FS is concerned. For the other fractions, FS events are mainly shifted leftwards from the main axis (dotted line).
