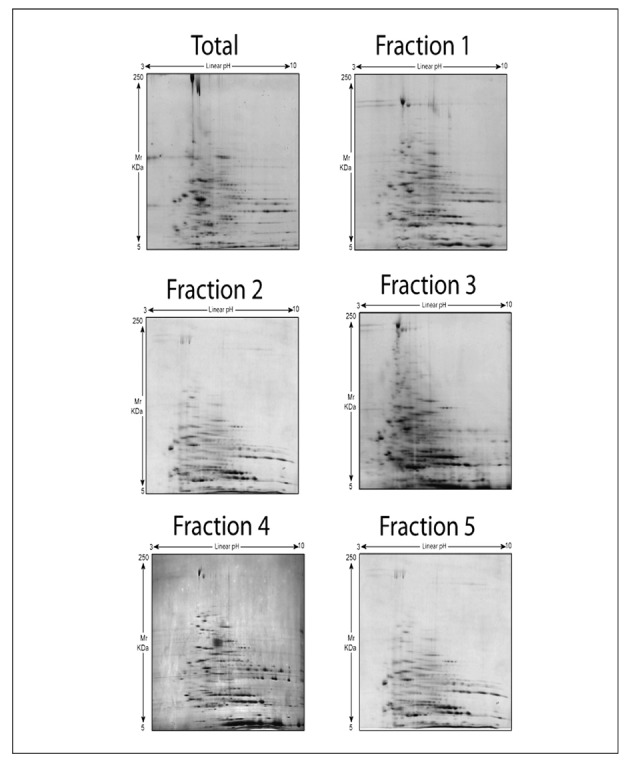
Figure 3.

Two-dimensional gel electrophoresis of freshly drawn RBC after separation into five distinct subpopulations through a Percoll density gradient. First dimension isoelectric focusing pI values linearly span between 3 and 10, while molecular weights are indicated on the left.
